contact request
* notwendige Angaben

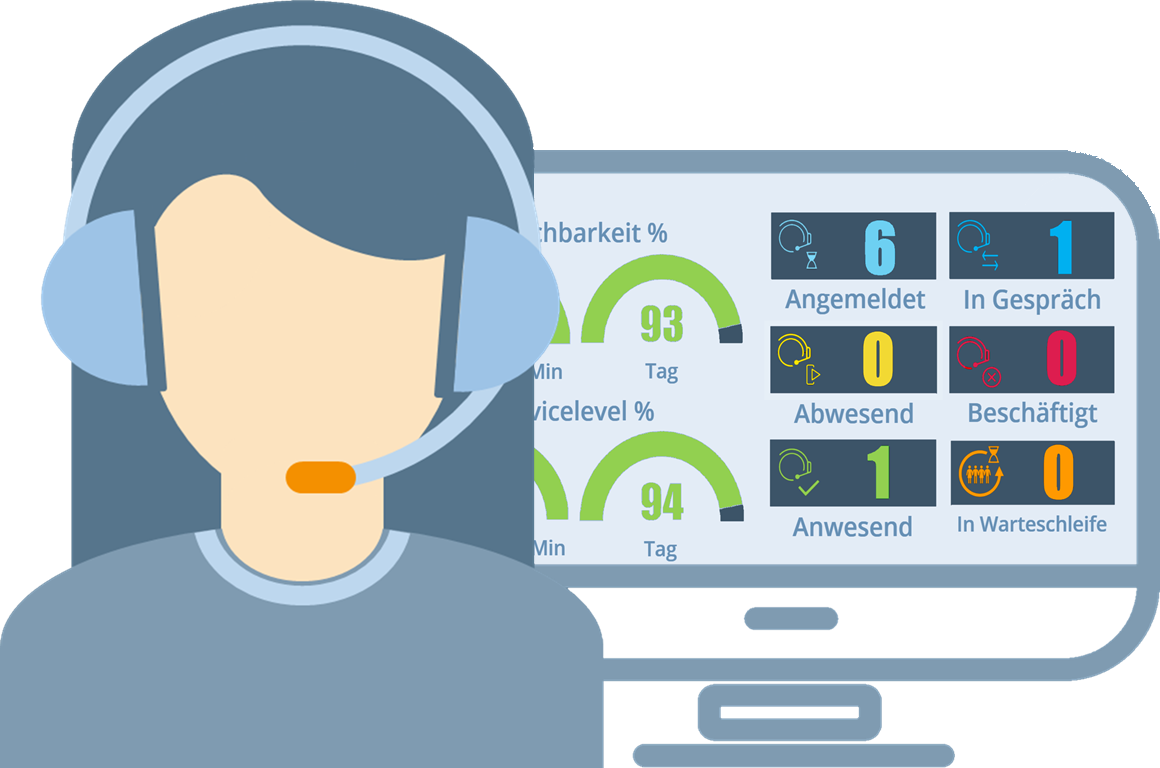
Customized dashboard values for Genesys Cloud - real-time and historical.
displayDings is an ideal tool to provide your teams and queues with extended visual information quickly and easily visible, individually.
displayDings is a highly customizable out-of-the-box package for different metrics and statistics, in real-time. Alle these statistics can be shown browser-based on a PC, on a wall board or even on a mobile device.
If defined threshold values are exceeded or undershot, alerts can be colour coded on the screen or notifications can be sent over IM clients (Webex, Microsoft Teams, …), texting and E-Mail to a supervisor.
In the standard package, all is based on teams or departments and a team can consist of one or more queues. Rights can be assigned very granularly on a role/permission basis (agent, team leader, all) and all of these can have different permissions, even broken down to an agent’s performance. Pre-defined layouts help you setting this up very fast. Everything is individually configurable and can be customized to meet the specific needs of every single customer.
We use the metrics provided by Genesys Cloud plus internal data, which can be used to calculate a plenty of values. As an option, further data, e. g. SQL sources or third-party systems accessible via RESTful APIs, can be integrated as well or the data can be exported to MS Excel or other BI systems.
Our architecture is based on Elasticsearch and Kibana (ELK Stack), which makes a rock solid and great solution for indexing, structuring and visualizing large amounts of data.
This is a cloud-based offering with no need to install any software, up and running in a short time.
Use this valuable data to make decisions that affect your SLA’s and KPI’s in real-time and increase the success of your Genesys Cloud Contact Center!
Advanced graphical display and design options:
Flexible options to include additional non-Genesys information and to show other information than Genesys KPIs
Create and Change Dashboards thru team leader
Automatic switch between dashboard views
Extended roles and permissions
Different Channels, Groups, KPI’s
These metrics are instantly available in the standard solution:
Per Agent
Number of Inbound/Outbound Calls (amount)
Agent Presence/RoutingStatu
Agent Status (list)
Erweiterte Rollen und Berechtigungen
Verschiedene Kanäle, Gruppen, KPI's
Per Team
Availability (%) per day
Availability (%) per interval (30 min)
Service Level (%) per day
Service Level (%) per interval (30 min)
Average waiting time (time)
Average call duration (time)
Waiting calls (amount)
Calls in progress (amount)
Total number of calls per day (amount)
RONA Quote (amount)
Number of calls that waited longer than 30 sec per day (amount)
Number of calls that waited longer than 60 sec per day (amount)
Number of calls that waited longer than 3 min per day (amount)
Number of calls that waited longer than 5 min per day (amount)
Number of calls that waited longer than 10 min per day (amount)
Number of calls that did NOT wait longer than 30 sec per day (amount)

Contact us!
As Deliberate, we are happy to help you take your customer service to the next level.